


- June 23rd, 2022
- /
- Intervention Toolkits
- /
- 0 Comments
- /
- Nutrient Cost Analysis Programme
FOOD ACCESSIBILITY: Nutrient Cost Analysis of Food Prices
UNIVERSITY OF TECHNOLOGY, JAMAICA
Background
To determine food security vulnerability, the FaN project first determined the lowest possible cost to obtain a balanced diet in the three project countries, Jamaica (JAM), St. Kitts & Nevis (SKN) and St. Vincent & the Grenadines (SVG). To assess vulnerability, the analysis identified what proportion of the minimum wage is required to obtain that low-cost nutritionally balanced diet. In developing the lists of foods for pricing, the following issues/criteria were considered:
- The staple foods in the country.
- The inclusion of foods from different groups: cereals, tubers, vegetables, foods of animal origin, fruits, sugars and fat.
- The dietary culture of the population.
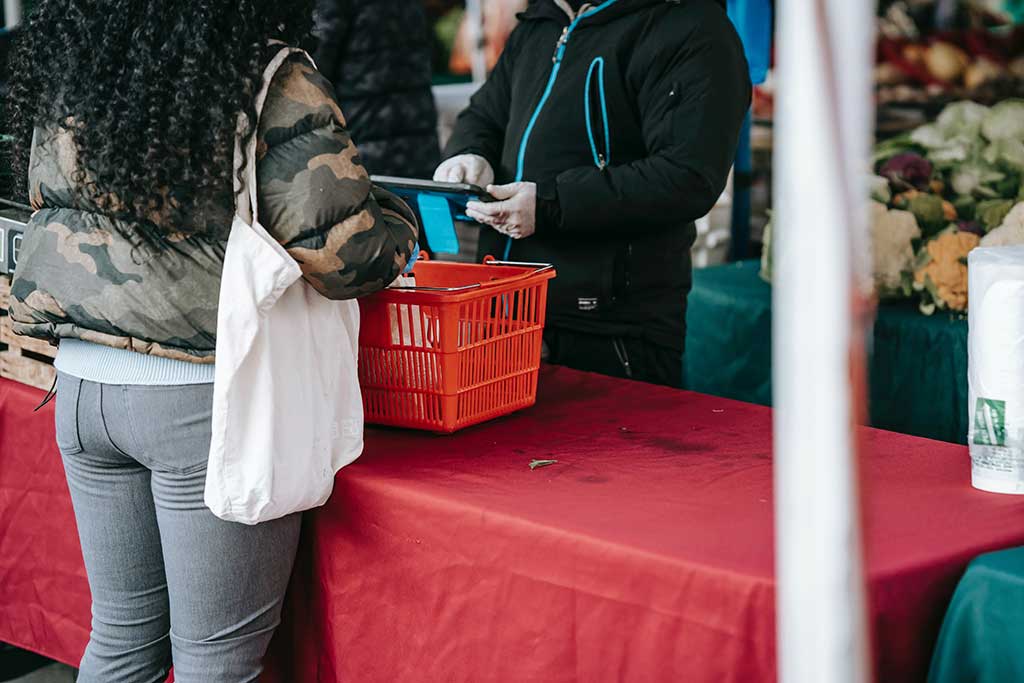
- To determine what consumers usually eat, only the most popular items from the most popular food establishments were recorded. The price data were then entered into the Nutrient Cost Analysis computer programme and nutritionally balanced diets and associated costs were generated for each community.
The programme that calculated the cost of food energy and protein from different food sources used the following procedure:
- Food prices were collected for a specified time period using a list with corresponding codes for the food items from the Caribbean Food Composition Tables.
- The prices collected were per unit quantity. These prices were entered into the programme which does a conversion into amounts of energy and protein per dollar spent.
- The programme ranked foods within specified food groups in ascending order based on cost of energy and protein.
The programme computed a diet/basket of foods which provided a specified amount of Kcal under given parameters based on the contribution of food groups to total energy (Kcals) and number of items selected from each Food Group.
Findings
 Discussion
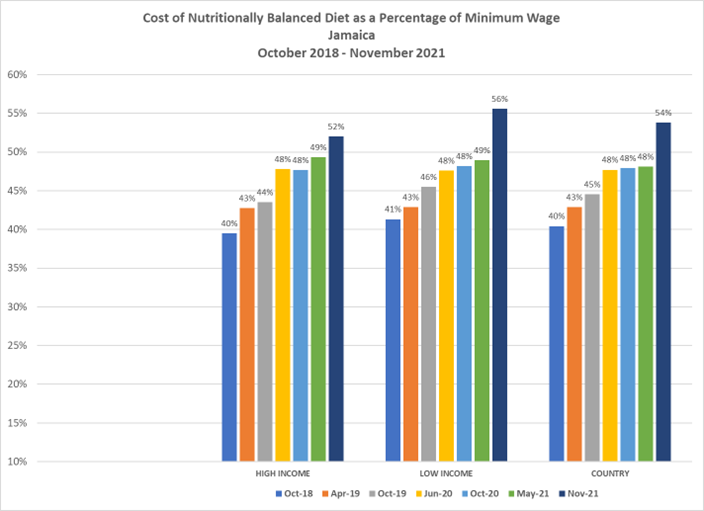
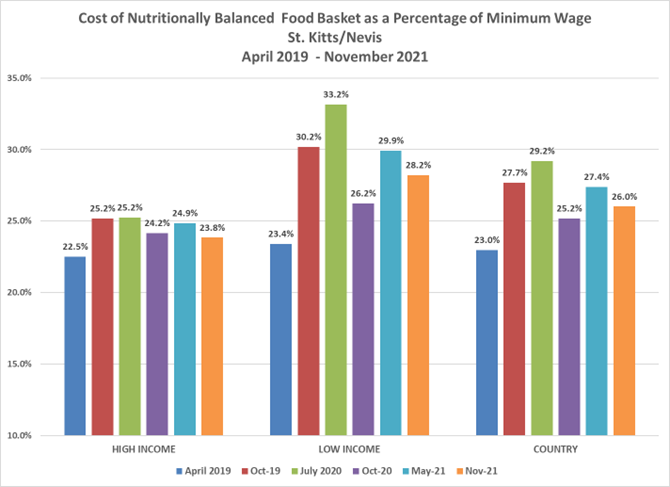
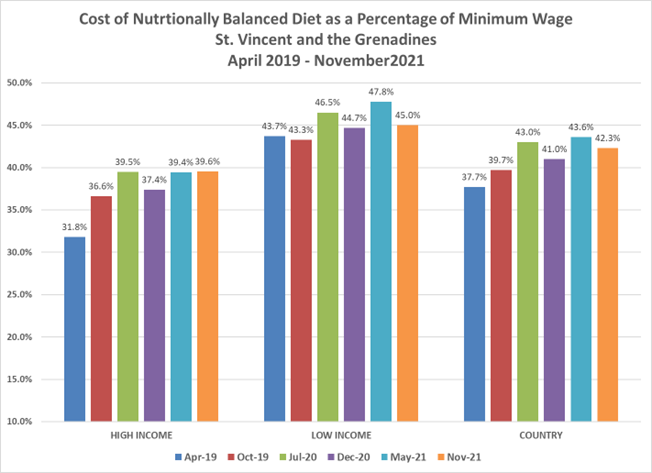
Over the review period of October 2018 to November 2021, data from the three countries showed increased prices for their Food Baskets. These increases ranged from 14% in SVG to 33% in JAM. In both JAM and SKN, the cost of the basket was higher in low income areas; SVG was the only country where the percentage increase in the cost of the Basket was relatively higher in high income areas.
In JAM, increases exceeded the movements in the Consumer Price Indices (CPI) for Food which averaged 11% over the period June 2020 to November 2021. Comparisons with earlier periods for the CPI were not possible because the base year for calculation was changed in 2019.
In SVG, a similar pattern was seen with the increases in the cost of the Food Basket outstripping the CPI for Food – 13.7% vs. 7.2% over the review period.
For SKN, the CPI for the Food Category increased by approximately 3% over the period compared with the 17% increase in Basket Cost.
The percentage of the minimum wage required to purchase the Food Basket was significantly higher in JAM and SVG comparted with SKN. For JAM on average, 46.5% of the minimum wage was required to purchase the Basket over the review period; for SVG this was 41.2%; and for SKN, this was 26.4%.